
Page 60 - GIS for Science, Volume 3 Preview
P. 60
AGGREGATING AND INTEGRATING DATA
Spatial biodiversity data comes in many forms: reported observations of individuals from citizen scientists and wilderness enthusiasts through popular apps such as Map of Life and iNaturalist; presence/ absence records of individuals from scientific surveys such as Dr. Naskrecki’s work in Gorongosa; museum records; range maps that delineate general habitat preferences of species; inventory lists of a geographic area generated by “BioBlitz” activities; and larger regional checklists, often at the national level. Each of these data varieties vary in spatial accuracy, the amount and type of information that can be gleaned from them, and the value and utility of this information to inform conservation. Furthermore, within each of these categories, biodiversity data can vary in its availability (bird enthusiasts outnumber ant enthusiasts by at least an order of magnitude), amount (in New York City versus Madagascar), confidence (was that a chipping sparrow or an American tree sparrow?), accuracy (how accurate are my GPS coordinates?), and precision (did I see two chipping sparrows, or was it the same one twice?).
It’s not surprising, then, to speak of the challenges of aggregating these disparate data types and integrating them to yield an accurate portrait of species distributions in space and time. Data aggregation is a continually ongoing cycle of identifying new data sources and potential collaborators, building partnerships, creating data-sharing agreements, ingesting new data, identifying what is usable, harmonizing taxonomies, updating datasets, and managing databases. This work is the nuts-and- bolts basis of building a comprehensive picture of biodiversity and often slips by underappreciated in the shadow of splashy, high-profile scientific publications that focus on the results of this work. Informatics underpins virtually every aspect of biodiversity research, and it would be folly to understate the importance of its role in facilitating our understanding of the biosphere.
48
GIS for Science
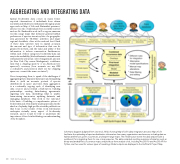
Schematic diagram (adapted from Jetz et al. 2012), showing Map of Life’s data integration process. Map of Life facilitates the uploading of species distribution information from many organizations and sources, including data on habitat preferences, point occurrences, and expert range maps. The infrastructure stores this data and provides a workbench for integrating them for one or many species. The data compiled, resulting summary information such as binary and probabilistic occurrence maps, and products from analysis tools, including ArcGIS Pro and ArcGIS API for Python, are then used for various types of modeling. Model outputs are displayed in the Half-Earth Project Map.
