
Page 61 - GIS for Science, Volume 3 Preview
P. 61
Methodology
As one of the Half-Earth Project’s core teams, Map of Life (www.mol.org) leads the biodiversity informatics research that informs the Half-Earth Project Map. Map of Life comprises a group of more than 25 data scientists, ecologists, taxonomic experts, postdoctoral associates, technicians, and students led by Jetz, and Robert Guralnick, a scientist at the Florida Museum of Natural History. “Our role in the Half-Earth Project is to deliver the science and information for effective conservation decision-making, to ensure that species are not unknowingly left behind,” Jetz said.
Map of Life has developed a complex and sophisticated process for integrating different datasets into a common modeling framework. The outputs of this framework provide a type of space-time-species data array known as an essential biodiversity variable (EBV), in which each datum specifies the occurrence probability of a given species in a given location at a given point of time. These EBVs can be used to infer a variety of ecological patterns such as species richness and change in community composition over time, and are what ultimately provide the high-resolution spatial information needed to guide conservation efforts.
Three measures of biodiversity
1
2 Species endemism is the proportion of the distribution of a species found in a given region, summed across all species in that region. This term is also known as total range-size rarity, rarity score, or weighted endemism.
3 Species rarity is simply species endemism divided by species richness, and is a measure of average geographic range-restrictedness of species in a given region. This is also known as average range-size rarity or simply range size rarity.
Species richness is a measure of the number of different species in a given region. This quantity can be summarized by distinct geographic regions such as countries or protected areas or by equal-area grids to reveal global patterns.
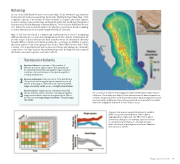
An occurrence model for the lodgepole chipmunk (Neotamias speciosus) in California. This model uses Map of Life’s infrastructure for data integration to combine range map (white outline) and observation data (orange points) with environmental variables and remotely sensed land-cover products to predict where the lodgepole chipmunk is most likely to occur.
A space-time-species essential biodiversity variable (EBV) of occurrence probabilities. When data is aggregated for single cells, the EBV informs about community change in, for example, species richness or compositional similarity, or—through ancillary data—functional or phylogenetic turnover. Adapted from Jetz et al. (2019).
Mapping Half-Earth 49
