
Page 18 - GIS for Science, Volume 3 Preview
P. 18
A COASTLINE JOURNEY
Imagine sailing every coastline of planet Earth. We are all familiar with the stories of intrepid seagoing explorers who set out from safe havens to cross the vast expanses of unknown oceans in hopes of discovering new lands. Their reasons were many—expanding empires, escaping persecution, seeking treasure, and satisfying
make the most definitive geographic characterization of global islands. We published the results2 in Esri’s GIS for Science, Volume 2, the predecessor to this volume. That work provided a definitive count and geolocation of global islands, and it happened as a fortuitous “by-product” of our global coastline inventory work. However, it also caused us to get temporarily side-tracked from our original intention of producing a definitive characterization of the world’s coastlines.
Leaving aside the magical allure of islands, this chapter focuses on the task at hand, a characterization of global coastal environments. This work comes at a time when spacecraft have explored the heavens and submersibles have explored the seafloor. Our team was profoundly moved and inspired by the accomplishments of Dr. Kathryn Sullivan, the only person to walk in space (1984) and dive to the deepest part of the ocean (2020) in the Marianas Trench (see a related ArcGIS StoryMap linked within this book’s companion website found at GISforScience.com). Although perhaps not as headline-grabbing as her outer- space and inner-space explorations, our team’s virtual “surface-space” scientific exploration of the global shorelines is the first of its kind.
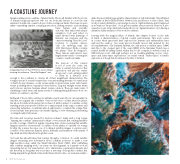
Cropped portion of the 1510 Hunt–Lenox Globe, showing the infamous "Here Be Dragons" text.
basic human and scientific curiosity. They sailed with simple navigation tools and relied on maps adorned with drawings of fantastic sea creatures and the ominous warning “Here Be Lions” (contrary to popular opinion, only one surviving map, the 1510 Hunt-Lenox Globe, contains the phrase “Here Be Dragons”). These famous explorations were largely transoceanic—crossing the oceans to reach new lands.
The purpose of this journey is not to cross the ocean, but rather to sail all of its shores. This exploration will ply the waters along every coast, sailing parallel to them at a distance close
enough to the coastlines to observe all of their magnificent characteristics. The voyagers are in for a treat because there is an astonishing diversity of coastal areas on Earth by any measure—rocky versus sandy, tropical versus polar, calm waters versus pounding waves, vegetated versus barren, long and straight versus twisty and tortuous, and yes, humans absent versus common. There are many ways of classifying coastal areas, and many criteria for distinguishing differences from one stretch of coastline to another.
Sailing all of the world’s coastlines would take several years. By our own calculations (and yes, we mapped the coastlines of the world—more on that later) the planet has about 2.5 million kilometers (more than 1.5 million miles) of coastline. A ship traveling nonstop at speeds of 20 knots—a typical speed in the cargo container and cruise ship industries—would take almost eight years to complete the voyage. That doesn’t include time spent at ports, island hopping, or slow-steaming in interesting or navigationally tricky areas.
The time and resources needed for such an endeavor make such a long voyage “running the coastline” impractical in ships or even aircraft. But orbiting satellites provide coverage of Earth in regular, repeating time cycles, meaning that satellite imagery exists for every stretch of coastline on the planet. So instead of a voyage by ship, the journey becomes one of looking at satellite images to capture every coastline of the Americas, Eurasia, Africa, Australia, and hundreds of thousands of big, small, and tiny islands in the global ocean.
Our team has already taken that journey through a collection of coastal satellite images, extracting new information about coastline positions to make a new high-resolution map called the Global Shoreline Vector (GSV). After publishing that coastline mapping work,1 our team—as often happens on journeys—took an interesting detour. Our team had set out to characterize coastal environments, and the first step in doing that was to produce a new map of the global coastline. But having mapped the global shoreline in the finest detail to date, our team was ready to
6 GIS for Science
