
Page 161 - GIS for Science, Volume 3 Preview
P. 161
Wind-generated noise
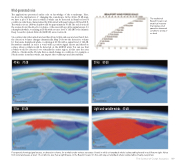
The applications presented earlier rely on knowledge of the soundscape. Here, we show the implications of changing the soundscape. In the 40 kn–70 dB map, we have a plot of the area in which a whale can be detected in Beaufort level 8 conditions, which are characterized by 40 kn wind, with seas between 12 ft and 18 ft. The wind noise at 1,000-m depth would be approximately 70 dB. The red dots in all the scenes shows the detection volume, or the area with a positive signal excess, for a humpback whale, vocalizing at 50 Hz with a source level of 135 dB for the Atlantic Deep Ocean Ecosystem Network (ADEON) sensor network.
On a calmer day, when winds are less than 5 knots (kn) and seas are less than 2 feet, the detection volume changes dramatically. Map D shows the detection volume for that same humpback whale, vocalizing at 50 Hz with a signal level of 135 dB. Everywhere marked in red is a voxel with a positive signal excess and therefore a place where a whale would be detected on the ADEON array. You can see that a whale would be detected over virtually the entire region, in this case the area offshore of Jacksonville, Florida. Even a small change in conditions, for example, a 5-kn decrease in surface winds, can impact the soundscape and detectability.
40 kn 70 dB
The traditional Beaufort scale is an empirical measure that relates wind speed to observed conditions at sea or on land.
30 kn
60 dB
10 kn 50 dB
Light and variable winds 40 dB
Four panels showing signal excess, or detection volume, for a whale under various sea states. Voxels in which a humpback whale is detectable plotted in red. Bottom right: Noise from wind and waves at level 1.5 conditions, less than a light breeze on the Beaufort scale. On this calm day, a humpback whale is detectable virtually everywhere.
The Science of Ocean Acoustics 149
