
Page 120 - GIS for Science, Volume 3 Preview
P. 120
The initial work showed that coral reefs generate $36 billion in tourism spending annually and drive almost 70 million visits per year worldwide. Developing economies, including Small Island Developing States (SIDS), relied heavily on coral reefs for tourism. For many of these countries, tourism is a lifeline, generating livelihoods, wealth, and foreign exchange. The research provided a much clearer understanding of the dependence of many of these nations on coral reefs, and the resolution of the work was already sufficient to support the management of these fragile ecosystems in some countries.
Innovations in AI in Mapping Ocean Wealth
The Mapping Ocean Wealth project under CROP allowed for several key advancements on the global model, notably, the application of emergent artificial intelligence/machine learning (AI/ML) technologies and methodologies to crowdsourced data. These methods yield datasets that can be used as data inputs into the ecosystem service models, improving traditional keyword searches used in previous studies and allowing us to map these and other distinct subcomponents of reef-related tourism, such as:
• Paddle sports: Heat map of nonmotorized watersports activities (e.g., kayaking and paddleboarding). These activities are often reef-associated and clearly depend on healthy natural coastal waters.
• Seafood restaurants: Heat map of seafood restaurants in the region. These restaurants are often largely dependent on the ability to serve fresh fish caught on or near reef habitats.
Each of the models incorporated the results of AI computer vision techniques and methodologies in image classification applied to Flickr photos and Tripadvisor photos. Logistic regression and natural language processing methods were applied to Tripadvisor reviews. We developed training data for our image classification models by selecting a significant sample of images from Flickr and TripAdvisor, while our text analytics models used selected text labels and terms explicitly from Tripadvisor reviews that best represented the elements to capture in the models. For example, for on-reef recreation and tourism, we selected photographs depicting underwater scenes or reviews that describe diving or snorkeling experiences; for beaches, images of beaches with dominant natural elements (e.g., white sands, turquoise waters, vegetation); a review describing a visit to a resort where the visitor ate delicious red snapper and rented a kayak would be tagged as “seafood” and “reef-adjacent activity.”
The team used Microsoft’s Azure Cognitive Services to classify the remainder of the photos from Flickr and Tripadvisor, iteratively refining the training layers until high levels of accuracy were obtained. To analyze text, another Microsoft team then applied a random-forest regression model to automatically classify the remainder of the reviews and return a list of reviews that matched each set of criteria. Our
• •
On-reef tourism: Map of use intensity and values of activities that take place on or near a reef, specifically, scuba and snorkeling.
Nature-dependent beaches: Map of use intensity and values of beaches that tourists perceive as exceptionally natural or pristine, perhaps because of clear and calm turquoise water, white sands, and foliage, which nearby reefs can influence.
models were evaluated based on metrics of precision and recall, as frequently found in the machine learning literature.
Data output could then be plotted on a map using either known locations of TripAdvisor locations to which photos and reviews were associated, or, in the case of Flickr, using the coordinates embedded in photo metadata.
These points were then combined with other data inputs, including names and locations of dive sites, dive shops, hotels, other attractions, and statistics and reports on tourism arrivals, expenditures, and reef-related activities. For on-reef activities and nature-dependent beaches, data were considered sufficiently reliable to build a direct model of value, developing a national- level estimate of importance to be expressed as tourism numbers and expenditure. These quantitative values were then linked to the maps of use intensity to spread actual values to coastal areas or ecosystems.
108
GIS for Science
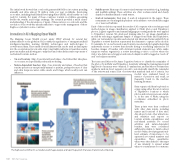
The high-level workflow for a crowdsourced image analysis and reporting system that uses AI and cloud computing.
