
Page 85 - GIS for Science, Volume 3 Preview
P. 85
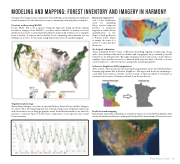
MODELING AND MAPPING: FOREST INVENTORY AND IMAGERY IN HARMONY
Using modern image services and server-based GIS has opened many new analytical research avenues for the American forestry community, including these examples:
Previous studies using MODIS
In the 2010s, FIA took a spectro-temporal approach using moderate spatial resolution imagery from MODIS to produce raster datasets of numerous forest attributes across the continental United States. Today, with ready access to imagery from a variety of sensors and powerful cloud computing environments, we are shifting our focus to do the same, using dense time series of Landsat imagery.
Harmonic regression
One of the techniques used for analyzing these spectro-temporal profiles is harmonic regression, which allows quantification of the shape of such profiles as a Fourier series, which is simply the sum of a series of cosine and sine functions.
Ecological ordination
These estimated Fourier series coefficients describing vegetation phenology, along with other auxiliary data such as climate and topography, are potentially powerful features for modeling forests. Through techniques such as canonical correspondence analysis, these predictors can be combined with response data collected on forest inventory plots to order tree species along environmental gradients.
k-Nearest Neighbors (kNN) imputation
The location of forest inventory plots along these gradients can be used with machine learning algorithms like k-Nearest Neighbors. This approach works by imputing to each pixel in the raster a “bucket of plots” based on their proximity to the pixel as measured in the space of features derived from the predictors.
   Vegetation phenology
By tracking changes over time in spectral indices derived from satellite imagery, we can monitor the beginning and end of the growing season (vegetation green-up and senescence) across large geographic areas. From this information, we infer the presence of various types of forest, their composition of tree species, and overall forest structure.
Prediction and mapping
Each bucket represents a distribution of attribute values, stored in the FIA database, that can be used as the machinery to make pixel-level predictions and maps of forest resources.
  From Plots to Pixels 73
