
Page 171 - GIS for Science, Volume 3 Preview
P. 171
Student project example 3
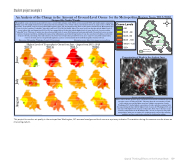
An Analysis of the Change in the Amount of Ground-Level Ozone for the Metropolitan Region from 20132-2016 Designed By: Natalie Warnke
Tropospheric ozone, also known as ground-level ozone, is created when nitrogen oxides (NOx), carbon monoxide (CO), and volatile organic compounds
(VOCs) reacts with sunlight. Emissions from industrial and electrical facilities, motor vehicle exhaust, and chemical solvents are major sources of NOx, CO, Ozone Levels and VOCs. Tropospheric ozone levels reach their highest points in June, July, and August because these are the sunniest months for the Metropolitan area.
Ozone levels are considered “unhealthy” when they reach Level 100 in the Air Quality Index. The ozone levels from the days with the highest levels of ozone in June, July, and August from 2013 to 2016 are mapped below. On the days with the highest levels of ozone, the levels of ozone reach the “unhealthy” level. This topic of analysis was chosen because high levels of ozone affect human and environmental health. Ground-level ozone can cause a variety of respiratory problems, including chest pain, airway inflammation, and reduced lung function. It can also cause harm to habitats, result in loss of species diversity, and change water and nutrient cycles. Some ways to help reduce ground-level ozone are to carpool or use public transportation, conserve electricity and use energy-friendly appliances, and use environmentally safe household and garden chemical solvents.
<50
50.01 - 60 60.01- 80 80.01 - 100 100.01 - 125 125>
!
Frederick
!
!
Rockville
! TacomaPark !
!
Data source: Metropolitan Washington Council of Governments
Information source: https://www.epa.gov/ozone-pollution
McMillian
River Terrace
Franconia
Prince George's County Equestrian Center
!
Southern Maryland
Concentration of Roads in the Analysis Area
Electronic version: http://arcg.is/WC5vC
Motor vehicle exhaust, gasoline vapors, and chemical solvents like windshield wiper fluid
are major sources of NOx and VOCs. This map shows the concentration of roads in the analysis area, and the lighter areas have a higher concentration of roads. Washington D.C. has the highest concentration of roads, and when compared with the maps showing the days with the highest levels of ozone, the Washington D.C. area has some of the higher levels of ozone on those days. Some ways to decrease ozone caused by transportation in the Washington D.C. area are to carpool or take public transportation, make sure car engines are working properly, and to follow refueling guidelines and have caution when refueling to avoid gasoline spillage.
This project focused on air quality in the metropolitan Washington, DC area and used ground-level ozone as a primary indicator. The variation during the summer months shows an interesting pattern.
Highest Levels of Tropospheric Ozone from June - August from 2013 - 2016
!
2013 2014 2015 2016
!!!!
!
!!!! !!!
!!!! !
!!! !
!!! !!
!!!!!!!!
!!! !
!!!!
!!! !!!!
!
!!!!
! !!!!
!!!!
! !!!!
!!!! !!!!
!!!! !!!!
!! !!
!! !!
!! !!!!
!
!! !!!!!!!!
!!! !!
!!!! !! !!
!! !! !!
!!
!! !!
!! !!!!
!!
!!
!!
!
Monitor_Sites
Area of Analysis
!
Long Park
!
Ashburn
Beltsville
!
Spatial Thinking Effects on the Human Brain 159
Aurora Hills
!
Calvert
August July June
