
Page 170 - GIS for Science, Volume 3 Preview
P. 170
158
GIS for Science
Student project example 2
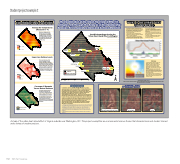
CONTRIBUTING FACTORS
The Examination of the Urban Heat Island Effect in Arlington, VA through the Analysis of the Relationship Between Air Temperature Data and Surface Materials
WHAT IS THE URBAN HEAT ISLAND EFFECT?
Value
High : 65.5065° Low : 55.763°
Value
High (100) Low (0)
Rosslyn 63.1852
Manmade Surfaces Natural Surfaces
Ronald Reagan National Airport
A CLOSER LOOK
The Pentagon
Rosslyn
Average Air Temperatures (Measured in °F)
This map is displaying the differences in the average air temperature throughout
Arlington County. The yellow areas represent the coolest areas whereas the red areas represent areas that are the hottest areas.
Impervious Surface Levels
This map indicates which
areas in Arlington County contain the highest amounts
of impervious surface materials. Such surfaces include sidewalks, streets, parking lots, etc. These surfaces cannot be penetrated by water. These locations are indicated in red and are most susceptible to containing heat.
Coverage of Manmade Versus Natural Surfaces
This map represents which locations in Arlington are covered by natural materials such as grass and trees and which locations are covered by manmade surfaces such
as asphalt and concrete. The urban heat island effect is
most likely to occur in locations that are covered by manmade materials.
Possible Areas Experiencing the Urban Heat Island Effect in Arlington
• An Urban Heat Island (UHI) refers to urban areas such as a city or industrial site, composed of large amounts of building materials, machinery and associated to artificial heating, that have significantly warmer air temperatures then surrounding rural areas.
• Urban areas consist of buildings, streets, sidewalks, and parking lots made with materials such as concrete and asphalt.
• These surface materials that do not absorb rainwater but retain heat absorb solar radiation during the day and release it at night, resulting
in higher night temperatures.
• These rises in air temperature increase the usage of air conditioners which requires more electricity to be used and ultimately more coal to be burned.
• The burning of coal results in the release of sulfur dioxide, nitrogen dioxide, particle matter, and carbon dioxide.
• Therefore, the biggest impact that UHI has on the environment and on people is the depletion of air quality.
Solutions
• Increase surface reflectivity (having high albedo) which reduces solar radiation absorption of surface materials. This can be done by covering surfaces (roofs & pavements) with a white or light colored paint or with a white membrane. See image to the left.
• Increase vegetation cover, mainly in the
form of urban forests and parks and green roofs. This would be done in order to maximize the multiple vegetation benefits in controlling the temperature rises.
• By cooling the surfaces, their asorbtion of solar radiation will reduce and air temperatures will decrease resulting in the reduction of air conditioner usage.
Tuckahoe 60.4268
Glebe 61.096298
ASF 62.1824
Swanson 62.282398
Kenmore 59.963001 Carlin Springs 59.614799
Campbell 62.516701
Wakefield 62.5037
Stations
Urban Heat Island
National Airport 63.527802
±
Miles 00.51 2 3 4
PROCEDURE
To determine which locations in Arlington County are possibly experiencing the urban heat island effect, a combination of factors and relationships were considered. In order to obtain sufficient temperature data, temperatures were recorded at four times of the day (8 AM, 12 PM, 4 PM, & 8 PM) from ten weather stations (see labeled sites) throughout the county over the course of approximately four weeks (April 11 - May 7). Then an average of all the data from each station was calculated and used in a spline test to create the map of average air temperatures. Next, the impervious surface levels data and land cover data was obtained from outside sources and was used, due to their contributions to the urban heat effect, to calculate which areas in Arlington County were experiencing its' effects. This calculation was made by using the raster calculator function and the following criteria was used to determine such locations:
1. Average air temperatures had to be 62 or above. This specification was determined by finding the median of the averages and using it
to distinguish the hotter half of the areas from the cooler half.
2. The impervious surface levels must have a value of at least 30. Areas lower then this value appeared to not have any impervious surfaces.
3. All manmade surfaces were included whereas natural surfaces weren't.
Map Design by Morgan Livezey
Data Provided by NOAA, Arlington County (VA) GIS Department, Earth Networks WeatherBug Network, ESRI, Driveway Impressions, and the EPA
A study of the urban heat island effect in Virginia suburbs near Washington, DC. This project exemplifies an environmental science theme that characterizes much student interest and a variety of student projects.
Average Temperatures are Included
