
Page 145 - GIS for Science, Volume 3 Preview
P. 145
Urban heat islands
Urbanization transforms more than just the ecosystem. It also changes fundamen- tal variables that influence weather and climate, such as land surface temperature, surface roughness, and evaporation. For many years, scientists have documented the changes in land surface temperature that result when natural or agricultural vegetation is replaced with parking lots, streets, and buildings. NASA describes land surface temperature as how hot Earth’s surface would feel to the touch in any particular location, ranging from the roof on a building or grass on a lawn to the snow on a highway or ice on a frozen pond. In urban areas, temperatures can be up to 8 degrees warmer than surrounding suburban or natural landscapes, increasing the amount of energy a city needs to keep its residents cool and comfortable.
The urban heat island effect occurs primarily during the day, when impervious surfaces such as roads and parking lots absorb more sunlight than the surrounding vegetated areas. Trees, grasses, and other vegetation naturally cool the air as a by- product of photosynthesis. They release water back into the atmosphere in a process called evapotranspiration, which cools the local surface temperature in much the same way that sweat cools a person’s skin as it evaporates. Trees with broad leaves, such as those found in many deciduous forests on the US East Coast, have more pores to exchange water than trees with needles, so they have more of a cooling effect.
In the United States, the presence or scarcity of vegetation is an essential factor in urban heating. Using data from multiple satellites, NASA researchers modeled urban areas and their surroundings and found that areas covered partly by impervious surfaces—such as city centers, suburbs, or interstate highways—had an average summer temperature 1.9°C (3.4° F) higher than surrounding rural areas. In winter, the temperature difference was 1.5 °C (2.7° F) higher.
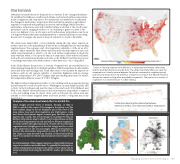
The highest urban temperatures relative to surrounding rural areas appeared along the Interstate-95 corridor from Boston to Washington, around Atlanta and the I-85 corridor in the Southeast, and near the major cities and roads of the Midwest and West Coast. Smaller cities had less pronounced increases in temperature compared to the surrounding areas. In desert cities, such as Phoenix, the urban area was actually cooler because irrigated lawns and trees provide cooling that dry, rocky areas do not.
Colors on the map represent the difference in temperatures between urban areas and the land that directly surrounds them. The urban heat island effect can raise the temperature of cities by several degrees Fahrenheit compared to neighboring rural and semirural areas due to the presence of impervious surfaces that absorb heat and disrupt the natural cooling effect provided by vegetation. The presence or scarcity of vegetation is an essential factor in urban heating.
Scatter plot depicting the relationship between impervious surface cover values and surface temperature.
Analysis of the urban heat island effect in ArcGIS Pro
These images provide views of Atlanta, Georgia, on May 6, 2020. Located in the center of the images is the urban core. The first Landsat image in the set displays a photo-like view of the area, where trees and other vegetation are bright green, roads and dense development appear cement-gray, and bare ground appears tan or pink. The second image is a Landsat Provisional Surface Temperature map in which cooler temperatures are blue and hotter temperatures are red and yellow. Because vegetation cools the surface through evaporation of water, the most densely vegetated areas (bright green in the first image) are the coolest areas (dark blue in the second image). Where development is densest, the land surface temperature is near 38° C (100° F). The last image is a map derived from Landsat of fractional artificial impervious surfaces in which darker areas have more impervious cover.
An initial analysis of the images indicates a relationship between impervious surfaces and urban heat. To quantify this assumption, surface temperature and impervious surface cover values can be extracted and plotted using the ArcGIS Pro scatter plot charting tool.
Mapping Extreme Events from Space 133
