
Page 144 - GIS for Science, Volume 3 Preview
P. 144
Plight of the Carolina chickadee
Extreme weather events such as heat waves and
drought affect the presence of certain bird species.
The small, round Carolina chickadee (Poecile
carolinensis) is frequently spotted in backyards in
the Southeastern United States. When it’s not at
the bird feeder, the chickadee resides in wooded
areas. But as temperatures change, these birds
may be less-commonly sighted in the Southeast.
For example, research by Cohen et al. (2020), finds
that several bird species, including the Carolina
chickadee, have shifted their behavior in response
to extreme weather. Datasets such as Daymet can support research that monitors species distributions based on climate anomalies and extreme events.
Scientists working with a Daymet dataset using ArcGIS Pro can derive bioclimatol- ogies using multidimensional tools and functions. It provides a platform to work with many types of scientific data. The multidimensional raster data mode and the analysis tools work with Network Common Data Form (netCDF), Hierarchical Data Format (HDF), a file format called GRIB, and many time-series satellite data produced from NASA missions. This example workflow uses ArcGIS Pro to process Daymet daily data, perform multidimensional raster analysis, and produce useful analytical products including climatologies, zonal analysis, spatial variation, anom- alies, and trend analysis.
To start, Daymet daily data are distributed in netCDF file format. Performing time- series analysis in ArcGIS Pro using Daymet’s daily data involves first creating a multidimensional Cloud Raster Format (CRF, an optimized raster format), then using geoprocesses in the multidimensional toolbox.
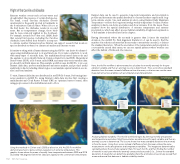
Using the methods in Cohen et al. (2020) as direction, this ArcGIS Pro workflow demonstrates how to derive similar evaluations of extreme temperature. This
graphic shows where the mean of weekly June temperatures between 2000 and 2018 exceeded 100 degrees Fahrenheit. Data are clipped to the continental United States.
Daymet data can be used to generate long-term temperature and precipitation profiles and determine the spatial distribution of areas that have experienced long- term extreme events. One such analysis product—using Daymet Daily Maximum Temperature—reflects the long-term average weekly temperature for June. Further analysis products can derive anomalies and show variance from the mean. These analyses show the spatial distribution of extreme temperature and extreme precipitation, which can affect species habitat suitability. A high-level explanation of this analysis is described later in the chapter.
Having determined where the anomaly is greater than 2 times the standard deviation, the ArcGIS Pro Find Argument Statistics tool can be used to find the number of months in each year that the anomaly consecutively exceeds 2, or 2 times the standard deviation. When the anomalies of the temperature and precipitation consecutively exceed their mean, we can see spatial patterns where weather can affect the habitat of birds and other species.
Here, the ArcPro workflow is demonstrated to calculate the monthly anomaly for the pre- cipitation variable and then an anomaly z-score is determined. The z-score shows standard deviation from the mean instead of difference from the mean, so that we can use the same measurement across variables such as temperature and precipitation.
Precipitation Temperature
Analyzing habitat suitability: This ArcGIS workflow begins by deriving monthly precipitation
and temperature anomalies. Monthly anomalies are determined for each variable, and then an anomaly z-score is determined. The z-score shows how many standard deviations the anomaly is from the mean. Using the z-score, instead of difference from the mean, allows the same measurement on the precipitation and temperature variables. The images are determined by calculating where the anomaly is greater than 2 for each month, and then finding the number
of months in each year where the anomaly consecutively exceeds 2 (i.e., 2 times the standard deviation). A researcher can determine spatially where the anomalies consecutively exceed their mean and record that data use in habitat suitability studies.
132
GIS for Science
