
Page 124 - GIS for Science, Volume 3 Preview
P. 124
4. Decision-making: Esri tools were used to create visualizations for stakeholder presentations. Solutions for reducing instances of ship strikes and bycatch could include stopping traffic through the islands or limiting the allowed transit speeds in this area. These solutions could help improve shipping lanes to reduce ship strikes and allow fishing vessels to operate without the risk of catching smaller marine mammals, such as dolphins.
Conclusion
OceanMind’s work would be impossible without modern computing resources, including cloud computing, AI, and, machine learning. At any one time, hundreds of vessels operate across wide areas involving many jurisdictions and thousands of regulations. Basing its work on temporal data, OceanMind depends on GIS to manage, analyze, and present information. Using the capabilities of ArcGIS software, OceanMind creates detailed analysis of multiple datasets, and uses the outputs to help inform partners about human activity on the ocean. This use of technology enables OceanMind to analyze more data in real time and do it more quickly, accurately, and cost effectively. The goal is to deliver insights to any government, in real time, telling them of suspected noncompliance in their waters. This capability can make a big difference in the work to reduce bycatch, ship strikes, and illegal fishing.
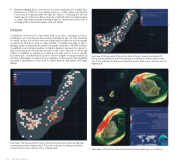
Heat map of fishing vessel AIS positions transmitted and marine mammal sightings, normalized around the highest value. The outline indicates the Mascarene Islands and associated oceanic features with a .2 degree grid.
Heat map oif fishing vessel AIS positions transmitting on speeds associated with fishing activity and marine mammal sightings, normalized around the highest value. The outline indicates the Mascarene Islands and associated oceanic features with a .2 degree grid.
112
GIS for Science
Heat maps of AIS position density and marine mammal sightings concentrations.
