
Page 77 - GIS for Science, Volume 3 Preview
P. 77
THE FOUNDATION
Each component of the FIA program—forest monitoring, the National Woodland Owner Survey, and TPO—realizes similar challenges. Each part must continue to support traditional customers and data users while growing the relevance of the program by transforming FIA’s product delivery machinery to serve an even larger number of groups.
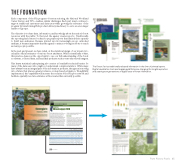
The objective is to share data, information, and knowledge about the nation’s forest resources with the public. To that end, the agency creates reports. Traditionally, the reporting had centered on hard-copy, paper reports that limited their capacity to build new audiences. Because printed reports increasingly are an outmoded medium, it became imperative that the agency continue evolving its efforts to reach as many people possible.
In the past and present, we have relied on the statistical design of our inventory to calculate official estimates of various forest attributes. While scientifically robust, this practice denies us the opportunity to use our full understanding of the forest ecosystem, collected data, and ancillary products such as remotely sensed imagery.
This heavy statistical underpinning also creates a formidable technical barrier for many of the data users who might not understand complex statistics. While maps have always been an integral part of the information products, the agency is moving into a future that places a greater reliance on map-based estimation. Thoughtfully implemented, this capability will increase the security of the FIA plot network and facilitate spatially resolute estimates at finer scales than currently possible.
The Forest Service traditionally released information in the form of printed reports. Digital visualization tools and mapping platforms are changing this longtime practice and creating new generations of digital users of forest information.
FORESTS OF Mississippi, 2015
RESOURCE UPDATE FS-100
This resource update provides an overview of forest resources in Mississippi based on an inventory conducted by the Forest Inventory and Analysis (FIA) Program at the Southern Research Station of the Forest Service, U.S. Department of Agriculture in cooperation with the Mississippi Forestry Commission. Estimates are based on field data collected using the FIA annualized sample design and are updated yearly. The estimates presented in this update are for the measurement year 2015 with comparisons made to data reported in 2006. Table 1 shows an overview of changes in State-level resource characteristics since 2006. The sample plot population in Mississippi consists of 5,553 plots (3,989 forested plots), collected across a period of 7 years (about 785 plots, or about 14-15 percent of the data per year). The estimates in 2006 consist of 1 year (100 percent) of data collected using the annualized sampling and estimation procedures. Growth, removals, and mortality
estimates are remeasurement plots from 2006, or about 3,610 plots. The data used in this publication were accessed from the FIA Database on August 16, 2016.
Overview
Mississippi is home to 19.4 ± 0.11 million acres of forest land. Forested area has decreased by about 1 percent (242,200 acres) since 2006 (table 1). The number of live trees on Mississippi’s forest land in 2015 was estimated at 13.5 billion, a decrease of 2 percent from 2006. Net volume increased about 16 percent from 2006 to 2015, from 29.7 billion cubic feet to 34.3 billion cubic feet. The net growth- to-removals ratio in Mississippi in 2015 was 1.96, with net growth averaging 1.9 billion cubic feet annually and re- movals averaging 969.8 million cubic feet annually. Mor- tality averaged 372 million cubic feet annually.
Table 1—Mississippi forest statistics, change between 2006 and 2015
Forest statistics Forest land
Area (thousand acres)
Number of live trees ≥1.0 inch d.b.h. (million trees)
Net volume of live trees ≥5.0 inches d.b.h. (million cubic feet)
Live tree aboveground biomass ≥1.0 inch d.b.h. (thousand oven-dry tons) Net annual growth of live trees ≥5.0 inches d.b.h. (million cubic feet per year) Annual removals of live trees ≥5.0 inches d.b.h. (million cubic feet per year) Annual mortality of live trees ≥5.0 inches d.b.h. (million cubic feet per year)
T imberland
Area (thousand acres)
Number of live trees ≥1.0 inch d.b.h. (million trees)
Net volume of live trees ≥5.0 inches d.b.h. (million cubic feet)
Live tree aboveground biomass ≥1.0 inch d.b.h. (thousand oven-dry tons) Net annual growth of live trees ≥5.0 inches d.b.h. (million cubic feet per year) Annual removals of live trees ≥5.0 inches d.b.h. (million cubic feet per year) Annual mortality of live trees ≥5.0 inches d.b.h. (million cubic feet per year)
Sampling 2006 error
estimate (percent)
19,622.3 0.61 13,814.0 1.47 29,663.9 1.44 757,247.6 1.30
830.3 1.13 1,897.1 2.23 983.6 5.57
19,396.8 0.63 13,732.9 1.48 29,243.5 1.46 746,468.3 1.32 1,380.9 2.19 1,076.4 3.17
342.7 3.49
2015 estimate
Sampling error (percent)
19,380.1 0.56 13,544.9 1.43 34,334.7 1.23 923,139.0 1.12 1,909.7 1.99
969.8 5.00 371.7 3.36
19,179.1 0.58 13,455.5 1.44 33,834.3 1.23 909,546.7 1.12 1,903.2 1.99
970.7 4.99 366.3 3.37
Forest Service | May 2015
1
From Plots to Pixels 65
