
Page 30 - GIS for Science, Volume 3 Preview
P. 30
CLUSTERING AND CLASSIFICATION
In addition to the data development effort to create coastal segments and attribute them with values for the 10 variables, we sought to identify global groups of segments with similar aggregate ecological settings. We therefore performed a TwoStep63 statistical clustering analysis in which all variables were included and given equal weightings, an “all-in and all-equal” clustering approach. However, the clustering was complex due to the number (10) and types (categorical and continuous) of variables, and the big data nature (4 million segments) of the inputs. Rather than operate in 10-dimensional data space, we sought to reduce dimensionality through statistical reduction of the complexity (variance) of the input data. We included all the data from the seven continuous variables in a t-stochastic neighbor embedding (t-sne) analysis,64 reducing the number of continuous variables from seven to two. The t-sne reduction is similar to a principal components analysis (PCA) but more appropriate for use with non-orthogonal data. Sonnewald et al.65 used t-sne to reduce dimensionality when clustering global plankton community structure and nutrient flux data for the delineation of marine ecological provinces.
Our final clustering routine included the three categorical variables and the two reduced continuous variables. Although the number of variables was reduced, it is important to note that all 10 variables were used to assess statistical variability of the aggregate ecological setting. None of the variables was dropped as unimportant or weighted less than any other variable. Our team did not constrain the clustering to output a desired number of classes and instead used the collective variability in the input data to identify an optimal number of clusters using a ratio of distance measure approach.66
Results and discussion
Coastal segment units (CSUs)
After attributing and classifying the 4 million segments, there were 22,534,848 total possible combinations (23 marine physical environment classes x 3 chlorophyll classes x 6 tidal range classes x 7 wave height range classes x 3 turbidity classes
x 18 climate region classes x 4 erodibility classes x 3 sinuosity classes x 4 slope profile classes x 3 river outflow index classes), of which a total of 80,977 unique coastal segment units (CSUs) were actually identified. A summary name descrip- tor for each CSU was developed as a simple concatenation of the attribute classes in this order: slope, sinuosity, erodibility, temperature and moisture regime, river discharge, wave height, tidal range, marine physical environment, turbidity, and chlorophyll. An example CSU label follows:
Steeply sloping, straight, medium erodibility, warm temperate dry, low river discharge, moderate wave energy, moderately tidal, euhaline-oxic-cool, clear, low chlorophyll.
Any one CSU may differ markedly from another CSU with considerable differences in the classes of all or most of the 10 attributes. Similarly, any two CSUs might be almost identical, with only slight differences in the classes of one or a few of the 10 variables. The sheer number of CSUs precludes a rigorous analysis of their individual global distributions and comparisons of the differences between them. However, in a basic inventory sense, the CSU data may have great utility for managers at local scales as a comprehensive inventory of ecological properties for a 1-km stretch of coastline in a management area.
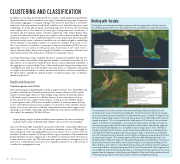
Working with the data
Clicking any coastal segment brings a pop-up with the query results. Shown here are the attribute queries from two 1-km segments from very different coastal environments.
The top panel shows the coastlines that surround Parque Nacional del Este in the southeast peninsula of the Dominican Republic. The bottom panel shows the coastal zone around the top end of the Bay of Fundy, New Brunswick, Canada. The Bay of Fun- dy has the largest tidal range in the world, and a query of its tidal range at this location reveals a range of 11.5 m, contrasted with a tidal range of 0.3 meters in the southeast region of the Dominican Republic. As a tide-dominated system, the Bay of Fundy is a low-wave energy system (0.39-m mean significant wave height), whereas the segment from the Dominican Republic is in a moderate wave energy class (1.2 m). The Bay of Fundy is eutrophic at this location, where the primary productivity as indicated by the chlorophyll level (8.3 micrograms per liter, or μg/L) is high. In the Dominican Republic site, the chlorophyll level is relatively low (0.3 μg/L), indicating a lower productivity from an oligotrophic system. The climate regions obviously differ dramatically from Cool Temperate Moist (Bay of Fundy) to Tropical Dry (Parque Nacional del Este). The marine physical environment also differs from Euhaline-Highly Oxic-Superchilled (Bay of Fun- dy) to Euhaline-Oxic-Warm to Very Warm (Parque Nacional del Este). Neither segment is strongly turbid or strongly sloping, and their sinuosities are similar. Each segment has low erodibility. Importantly, fluvial importance in the Bay of Fundy segment is four times greater than the segment in the Dominican Republic. Note that the last attribute listed in the pop-up query box is the ECU/cluster to which the segment belongs.
18
GIS for Science
