
Page 27 - GIS for Science, Volume 3 Preview
P. 27
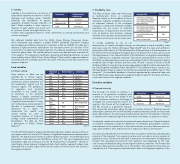
 5. Turbidity
7. Erodibility class
The effect of waves, tides, and rivers acting as hydrodynamic forces on substrates depends mostly on the erodibility of those substrates. Substrate erodibility is therefore an important element of the ecological setting of a coastal area. Relatively erodible substrates are the source of materials characteristic of depositional environments such as beaches and estuaries, whereas relatively inert substrates are associated with erosional environments such as rocky coasts.
Turbidity in the coastal zone is a function of
water-driven sediment movement in riverine
discharge and shoaling waves. Turbidity
influences the distribution of aquatic
vegetation primarily through reduction of
light.42 Water turbidity is often used as a
measure of water quality, and events such
as cyclones, floods, and algal blooms can
increase total suspended matter to levels detrimental to primary productivity and nutrient exchange.43
We obtained turbidity data from the NASA Ocean Biology Processing Group, which developed and maintains a global MODIS (Moderate Resolution Imaging Spectroradiometer) Diffuse Attenuation Coefficient at 490 nm (Kd490). The data are a measure of light penetration (attenuation) into the water column as a function of the concentration of organic and inorganic particles. The data are available as a 1-km spatial resolution global raster. The turbidity data are continuous data and were used as such in the analysis. For subsequent classification grouping and labeling purposes, we used three turbidity classes (Table 5) from Shi and Wang.43 Each coastline segment midpoint was attributed with a turbidity value from the raster cell whose center was closest to the segment midpoint
 Turbidity Level
 Diffuse Attenuation Coefficient (m-1)
   Clear
  Less than 0.1
   Moderately Turbid
  0.1–0.3
   Turbid
   More than 0.3
  Lithological Class
 Erodibility Class
 Acid Plutonics, Acid Volcanics, Intermediate Plutonics, Metamor- phics, Carbonate Sedimentary, Mixed Sedimentary
  Low
  Basic Plutonics, Basic Volcanics, Intermediate Volcanics, Siliciclas- tic Sedimentary, Evaporite
  Medium
  Unconsolidated Sedimentary, Pyroclastics
   High
 Water, Ice, Glacier, Other
  Not Assigned
     Land variables
6. Climate setting
Every location on Earth can be classified by its climate regime. The two most common and widely understood climate properties are the temperature regime and the moisture regime. The distribution of vegetation and terrestrial ecosystems in the coastal zone, as elsewhere in the terrestrial domain, is largely controlled by temperature and precipitation.27,40,44 Integrated measurements of long- term temperature and precipitation describe a fundamental climate expression for a region. To characterize the coastal zone climate setting, we used an integrated measure of long-term average annual temperature and precipitation. The data are from a delineation of World Climate Regions.45
To include erodibility as one of our
determinants of coastal ecological settings, we developed a simple erodibility index data layer using the Global Lithological Map (GLiM)48 and the logic and definitions presented in Moosdorf et al.49 We had used the GLiM previously in the development of the GEO-commissioned global ecological land units (ELUs),50 but in that case we used lithology because it is an important driver of the distribution of vegetation assemblages due to differences in substrate chemistry.51 We used a rasterized 250-m version of the GLiM that we developed previously when delineating the ELUs. We assigned a relative erodibility class of high, medium, and low to the 13 Level 1 classes in the set of GLiM attributes (Table 7) using the logic and average global erodibility indices developed for the GEroID (global erodibility index) framework.49 Four additional minor classes in the lithology dataset (water, ice, glacier, and other) were assigned an erodibility class of “Not Assigned”. Our erodibility datalayer is therefore represented by categorical data, and the erodibility class value assigned to a segment midpoint was from the raster cell whose center was closest to the segment midpoint.
Coastline variables
8. Regional sinuosity
Table 5
Table 7
 Temperature Moisture Regime Climate Region Regime
    Polar Desert Polar Desert
  Polar Dry Polar Dry
  Polar Moist Polar Moist
  Boreal Desert Boreal Desert
   Boreal Dry Boreal Dry
   Boreal Moist Boreal Moist
  Cold Temperate Desert Cold Temperate Desert
   Cold Temperate Dry Cold Temperate Dry
   Cold Temperate Moist Cold Temperate Moist
   Warm Desert Warm Temperate Temperate Desert
   Warm Dry Warm Temperate Dry Temperate
   Warm Moist Warm Temperate Temperate Moist
   Subtropical Desert Subtropical Desert
   Subtropical Dry Subtropical Dry
   Subtropical Moist Subtropical Moist
   Tropical Desert Tropical Desert
   Tropical Dry Tropical Dry
 Tropical Moist Tropical Moist
   The sinuosity of a stretch of coastline is a
measure of its geometric complexity and
is defined as the ratio of the length of the
actual, curvilinear coastline to the length of
a straight line connecting both ends of the
segment. Also known as the roughness in-
dex (RI), sinuosity is a geometric indicator
that can provide information about the type of coastline structure.14 Relatively smooth and straight coastlines with a low RI are likely to represent beaches, bluffs, or rocky head- lands, depending on the erosional and depositional nature of the substrate. Stretches of coastline with a relatively high RI are more likely to be deltaic or estuarine in nature.
Ecologically, coastline sinuosity has terrestrial and marine dimensions. Terrestrial impacts of coastline complexity include the distribution of freshwater, groundwater, nutrients, and sediments to the coastal zone. In the marine domain, sinuosity influences wave en- ergy, water residence time, and protection or exposure of biotic communities.52
Our team calculated the RI of every 10-km stretch of coastline, rather than calculating the sinuosity of the individual 1-km segments, and as such, our index is more a measure of regional sinuosity. This decision was made in response to the observation of Nyberg and Howell14 that calculating sinuosity from 5-km segments was inadequate for the “cap- ture”of many landward-intruding, funnel-shaped coastline complexes. The RI values are continuous data and were used as such in the analysis. The regional sinuosity value cal- culated from the 10-km segment was attributed to each of the segment midpoints of the
 Sinuosity Class
 Sinuosity (unitless)
   Straight
  Less than 1.5
   Sinuous
  1.5–5.0
   Very Sinuous
   More than 5.0
   The World Climate Regions analysis identified 6 temperature regime classes and 3 mois- ture regime classes for a total of 18 classes of integrated temperature and precipitation (Table 6). The data are raster format at a 250-m spatial resolution. The temperature and precipitation input data are from WorldClim version 2.0.46 The input temperature and precipitation data are continuous, but the 18 resulting IPCC-compatible47 World Cli- mate Region classes represent categorical data. Each coastline segment midpoint was attributed with a climate region value from the raster cell whose center was closest to the segment midpoint.
Table 6
Earth’s Coastlines 15
Table 8
