
Page 24 - GIS for Science, Volume 3 Preview
P. 24
and any references we might make to “clustering the segments” in reality refers to clustering the data associated with the segment midpoints. A similar approach was taken in the development of the ecological marine units (EMUs),21 where a 3D point mesh was developed and individual points spatially represented a cuboidal volume of water around the point.
Step 3 – Variable selection, attribution of segments, and classification
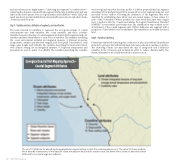
The team selected 10 variables to represent the ecological settings of coastal environments—two land variables, five ocean variables, and three coastline variables (as seen in the map of coastal segment attributes). Each segment midpoint was then attributed with values for each of the 10 variables. The variables describing the ocean environment included an integrated measure of physical properties (temperature, salinity, and dissolved oxygen), and chlorophyll concentration, tidal range, wave height, and turbidity. The variables describing the land environment were climate setting, (as an integrated measure of long-term temperature and precipitation), and an index of erodibility. The variables describing the coastline
were its regional sinuosity, the slope profile of a 200-m perpendicular line segment extending 100 m landward and 100-m seaward from every segment midpoint, and an index of river outflow. Following the attribution of the segments, they were classified by establishing class labels and associated ranges of class values for each of the 10 variables. Where possible, the class labels and class value ranges were consistent with the Coastal and Marine Ecological Classification Standard (CMECS)24 nomenclature and breakpoints. The classification step resulted in the development of the coastal segment units (CSUs), defined as any segment with a unique set of class labels for the 10 attributes. The variables are more fully described later.
Step 4 - Statistical clustering
Preliminary statistical clustering was conducted on all points, with all 10 attributes included, to group points with similar land-side, water-side, and coastline properties. The clustering routine accommodated the mix of categorical and continuous variables in the 10 inputs and included an effort to reduce dimensionality. The statistical analysis is more fully described in a later section.
12
GIS for Science
Ecological Coastal Unit Mapping Approach— Coastal Segment Attributes
The set of 10 attributes for describing the aggregated ecological setting in which the coastal segments occur. The values for these variables, which describe characteristics of the adjacent ocean, the adjacent land, and the coastline itself, are drawn from a variety of data sources and attributed to the coastal segment midpoints.
