
Page 208 - GIS for Science, Volume 3 Preview
P. 208
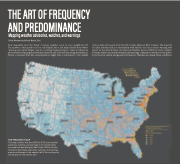
 THE ART OF FREQUENCY
AND PREDOMINANCE
Mapping weather advisories, watches, and warnings
Emily Meriam and Kevin Butler, Esri
How frequently does the threat of severe weather occur in your neighborhood? The answer to this question is not only helpful, but it can help identify areas where "warning and watch fatigue" may be occurring. Experiencing too many notifications about weather warnings and watches raises the risk of people becoming desensitized. NOAA concluded that this desensitization might have contributed to the deaths
of more than 150 people from the 2011 Joplin, Missouri EF-5 tornado. The majority of Joplin residents did not immediately seek shelter once the tornado warning was issued. In the United States, the National Weather Service (NWS) provides weather forecasts, which can include watches and warnings of hazardous weather to the public for protection, safety, and general information. Watches are issued when conditions
  THE FREQUENCY MAP
This map confirms that from 2003 to 2019, most weather advisories, watches, and warnings in the United States occurred near and along the East Coast. Within the con- tinental United States, advisories, watches, and warnings were more frequent in the eastern half of the country and less frequent in the western half.
196 GIS for Science
