
Page 205 - GIS for Science, Volume 3 Preview
P. 205
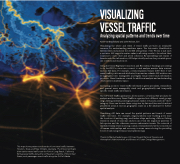
 This map shows patterns and trends of tow vessel traffic between Houston, Texas, and New Orleans, Louisiana. The three inset maps show tanker vessel traffic near the Port of Long Beach, California, fishing vessel traffic along the northeastern coastline of the United States, and passenger vessel traffic along the Gulf of Alaska.
Keith VanGraafeiland and John Nelson, Esri
Visualizing the where and when of vessel traffic provides an invaluable resource for understanding maritime space. The Automatic Identification System (AIS), included in the ArcGIS Living Atlas of the World, is just such a resource. AIS supports marine radar in allowing vessels to broadcast their locations to each other and avoid collisions. By assembling vast reams of breadcrumb-like information, AIS helps identify and resolve potential space- use conflicts and much more.
Using the Create Big Data Connection and Reconstruct Tracks geoprocessing tools, ArcGIS Pro users can connect to and analyze massive data sources, such as AIS data. For example, comma-separated values (CSV) files of raw vessel traffic positions and attributes from marine cadastre AIS archives can be aggregated into manageable and highly visual vessel track information products. Vessel tracks are crucial for additional analysis and understanding of key users in maritime space.
Increasing access to vessel traffic information gives specialists, researchers, and general users manageably sized and geographically and temporally specific vessel traffic information.
The US Vessel Traffic application allows users to download AIS products for analysis and discovery. Vessel Traffic is organized into different vessel groups: cargo, fishing, military, passenger, pleasure, tanker, tow, and a catch-all “other” category. Users can browse these categories by date and time and download predefined areas at various geographic scales as a file database for further spatial analysis.
Visualizing AIS data can reveal the spatial patterns and trends of vessel traffic over time. For example, ringed patterns near bustling ports trace the locations of waiting cargo and tanker ships anchoring offshore. Fishing vessels in search of seasonal catches can reveal the migratory patterns of fish species and the otherwise unseen underwater terrain. The network of maritime transportation among coastal communities shows the connections of human relationships and economy, in some cases echoing the prevailing forces of national governance and epidemiology.
Thanks to MarineCadastre.gov, US Coast Guard, National Oceanic and Atmospheric Administration, and Bureau of Ocean Energy Management.
Technology Showcase 193
VISUALIZING
VESSEL TRAFFIC Analyzing spatial patterns and trends over time
